NHIP Data Reports
Domestic Violence PIT 2023
Empty GPD beds 2023
Sacramento Coroner's Report'
Black to White Shelter Accessibility Analysis
Homeless Housing Ranking Systems
Continuum Rankings
Homeless Estimates
Homeless Point in Time Count Comparison:
MORE ANALYSES:
Chronic Homeless Estimates:
HMIS Bed Coverage
HMIS Continuum Bed Coverage Comparison:
Homeless Housing Inventory
Continuum Housing Inventory Charts:
SPECIAL NHIP REPORTS
New! Sheltered Count Change PIT 2023 vs. 2024 by CoC
* * * *
New! Gender Reporting by State PIT 2024
* * * *
PIT 2007-2022 by CoC
* * * *
PIT 2020 by CoC results
NEW! State-by-State PIT 2020 Totals
* * * * * *
SF January 2020 Homeless Monthly Report
* * * * * * * *
Chart showing underrepresentation of Asians in PIT count in 12 communities
* * * * * *
Chart shows 9 percent drop in Transitional units
An NHIP Brief Report comparing CoC transitional unit capacity in 2015 and 2016 reveals a 9% drop of 15,035 units from 159,784 in 2015 to 144,749in 2016. Twenty-three (23) CoCs reported a drop of 200 or more transitional units with 50 CoCs increasing transitional units by 20 or more. Transitional housing units peaked in 2009 with over 207,000 units.
New York City (-782) and San Diego (-718) led the transitional unit decreases. Kansas City (+201) and BOS Connecticut (+187) led the CoC with increases. On average, CoC decreased transitional capacity by approximately 38 beds. Funding of transitional units is no longer a HUD funding priority. The NHIP advocates for CoCs to convert their transitional facilities into Permanent Housing.
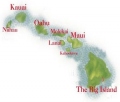
2015 Hawaii
Homeless Service Utilization Report
The Center on the Family at the University of Hawaii-Manoa has released its 10th annual 2015 Hawaii Homeless Services Utilization report covering the entire State of Hawaii. The report is funded through CoC HMIS funds and provides detailed demographic, utilization, intake and recidivism statistics for pe
rsons receiving outreach, shelter, rapid rehousing or Permanent Supportive Housing services. CLICK HERE to view the entire report.
NEW ANALYSIS:
DISTRIBUTION OF HIC TRANSITIONAL BEDS AMONG CONTINUUMS:
The NHIP has completed a brief analysis showing the distribution of Transitional Housing Beds listed in the 2015 HIC. A total of 143,606 were listed nationwide, representing 21% of all HIC beds. Safe Haven, Domestic Violence and RRH beds were not included in this analysis.
Continuums with transitional housing funded in part by HUD may be subject to funding cuts in future years. The NHIP recommends converting transitional housing to permanent housing to better serve clients. In many cities, most, though not all, transitional housing facilities are no different than ordinary permanent affordable housing. The NHIP also recommends that HUD reclassify transitional housing as non-homeless or permanent housing to eliminate future funding issues. Lumping persons living in transitional apartments with individuals living on the streets confuses the issues. This is akin to lumping unemployed persons with those obtaining 24-month work contracts.
Large cities where transitional housing beds represents a plurality includes Honolulu (54%), San Diego (47%), and Denver (42%). Large cities with low percentage of transitional housing include New York City (4%), Cinncinati (9%), and Boston (9%). For a full listing sorted by Transitional Housing proportion, CLICK HERE.
CONTINUUM CHRONIC HOMELESS REPORTS:
The NHIP has posted two (2) files comparing chronic homeless estimates from 2013 to 2015 by Continuum. Files are available in PDF or .XLS for sorting. Since new files on the left hand side of this page.
NEW NHIP REPORT:
Analysis of VASH allocation and change in veteran homeless counts by state
An analysis comparing new VASH voucher deployment and changes in homelessness at the state level yielded the following findings:
1) A total of 49,803 new VASH vouchers were allocated between 2011 and 2015.
2) Veteran homelessness decreased 17,720 from 65,445 in 2011 to 47,725 in 2015.
3) A one unit increase in VASH vouchers was correlated to a 0.36 unit decrease in homelessness. Ratios among 54 states and territories ranged between -1.35 (New York) to 0.76 (South Dakota).
The report discusses what the findings could suggest concerning progress towards ending homelessness at the state level.
REPORT: Homeless Point-in-Time Count: 2015 vs. 2014
While homeless estimates reported a modest decrease in the number of persons homeless on a single day (2.0% decrease), with decreases in both unsheltered homelessness (1.2% decrease) and sheltered homeless (2.4%), these totals veiled large changes in both directions at the Continuum level.
In an analysis of count estimates from 2014 and 2015, the NHIP found that 207 Continuums reported increases in unsheltered homelessness from 2014 to 2015, while 147 Continuums documented increases in sheltered homelessness. Overall, 157 out of 402 Continuums experienced an increase in homelessness with notably large increases in New York City, Seattle, and Los Angeles. A total of 58 Continuums reported that estimates of total homelessness increased by more than 15 percent in the past year.
In addition, a total of 45 Continuums reported large decreases (20% or greater) in homelessness. Some of these large decreases appear to be adjustments or corrections to the 2014 count, including MI-516 (-69%), AL-505 (-64%), CA-523 (-76%), FL-519 (-70%), and NJ-515 (-70%).
See the full listing by Continuum by reading the 2015 vs. 2014 report.
A grassroots collaboration sharing information and knowledge about homeless services