2016-2018
BRIEF REPORTS FROM 2016 to 2018
********************************************************************************************
HUD Budget set to increase
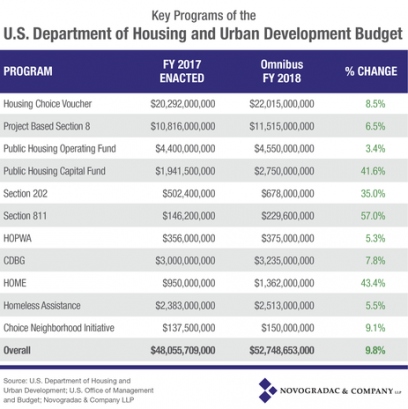
(May 21, 2018) Despite fears of large reductions in the HUD budget as proposed by the Trump Administration, the FY2018 $1.3 trillion Omnibus Bill passed in late March contains significant increases for HUD programs including homeless services, Housing Choice Vouchers, CDBG and Home programs. One of the largest increases is targeted for public housing repairs with a 41.6% increase in the Public Housing Capital Fund. It is estimated that public housing repairs total in excess of $25 billion. Homeless Assistance Funding is slated to increase approximately $130 million which will fund up to 25,000 new Permanent Supportive Housing units.
Additional provisions in the Low-Income Tax Credit program will reduce some of the impact caused by lower corporate tax rates which reduce the leverage of the program. Below is a brief detail from Novogradac:
* * * * * * * * * * * *
HMIS participation slightly lower; BOS CoCs struggle
Data from the recently-released 2017 Housing Inventory Charts show a small decrease in the overall HMIS participation rate among non-DV emergency, transitional and safe haven facilities. A total of 290,151 out of 351,168 beds (84.6%) were reported to be entering data in CoC HMIS around the country. This reflects a small, but important, drop from the 2016 rate of 84.8%. Participation had increased every year since implementation began in the mid-2000s.
An analysis of the 34 Balance of State CoCs reveals significantly lower participation rates. BOS CoCs typically receive less federal homeless planning funding despite having a larger and more difficult area to enumerate. The chart below lists participation rates sorted from highest to lowest.
.jpg)
* * * * * * *
Housing and Homeless Bill of Rights and Obligations
The NHIP proposes a new Bill of Rights and Obligations that addresses some of the long-time pathologies and perversions in U.S. Housing policy:
Right and Obligation 1: All Housing is Permanent
All facilities or shelters will not have any length of stay restrictions. Persons staying in a shelter are considered to have a home. They may stay at this home until they desire to move to another location. Facilities will charge a modest fee for long-term stays like any SRO, hostel or hotel.
Right and Obligation 2: All Housing facilities must provide a raised bed or cot for sleeping
All housing/shelter facilities will provide a minimum of a raised cot or bed that is above the floor level. If facilities are unable to provide this basic level of housing comfort, they should close.
Right and Obligation 3: Rent will not change due to Income changes
While initial eligibility for a housing facility may have general income eligibility rules, rents do not change based on changes in income or addition of family members. This is currently a discriminatory practice under the Brooke Amendment which has caused much of homelessness and household fragmentation.
Right and Obligation 4: Sheltered persons are not defined as homeless
Persons living in a facility are no longer defined and/or called "homeless persons". Amendment 1 allows these persons and household to stay as long as needed. The practice of labelling person as "homeless" when they have a place to sleep is discriminatory.
Right and Obligation 5: Persons using Domestic Violence shelters are not defined as homeless
Persons seeking assistance at domestic violence facilities are not defined as homeless since Domestic Violence is a separate social problem related to an on-going crime. The domestic violence housing utilization should be reported separately from the number of persons in unsheltered situations and other housing facilities. Household characteristics including family income are significant different than households experience general homelessness.
Right and Obligation 6: Single persons needing housing will accept shared living apartments and houses
Shared living (2 to 4 people in an apartment or house) is a normative standard for most people who are not married and not wealthy. Providing an apartment to a person with housing stability issues is an expensive option that should be limited to persons who need solitary living due to diagnosis, typically less than 10% of population. Shared living placement can create thousands of additional placements with the same amount of public funding.
More Rights and Obligations to come !
*********
Published 11.20.17
20 Most Expensive Cities and a History of High FMR rates
The NHIP has completed an analysis of the Top 20 most expensive cities in the U.S. using the recently released Fair Market Rent standards for 2 bedroom units. The chart below shows the Top 20 cities with both their 2018 and 1983 FMR rates and the annualized rate of rent increase over the past 35 years.
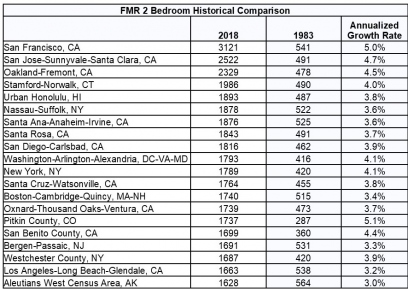
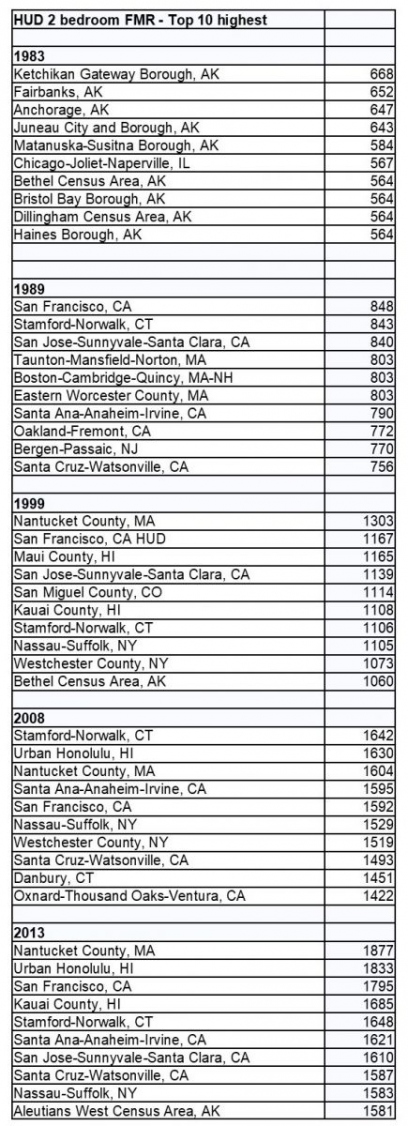
Here is a top 10 list for selected years since 1983. Interestingly, cities in Alaska used to be the most expensive along with Chicago. Chicago has seen only average rental increases over the last three decades.
* * * * * * * * *
Built for Zero vs. Federal Benchmarks
Continuums have been inundated in recent years with national initiatives by government entities and technical assistance groups to achieve various empirical benchmarks in homeless services. Over the last couple years, both Community Solutions and the USICH have introduced veteran-focused initiatives aimed at showing cities are "ending homelessness" and have needed infrastructure and capacity in place to assist all veterans experiencing homelessness.
Confusion between these two initiatives has been exacerbated by the changing names of the campaigns (Functional Zero, Vets Zero, Zero 2016, Built for Zero, Less than Zero (oh, that was a book). The new Federal Benchmarks begun by USICH in colloboration with the VA is the more recent. The facf that HUD has not mandated participation or otherwise assigned points in its annual application for participation in either campaigns also lends confusion about the important of whether communities need participate.
The NHIP has been providing technical assistance to CoCs about the benchmarks and has found understanding the differences and explaning the differences to providers quite challenging. The table below summarizes some of the key differences in characteristics.
.jpg)
Both initiative share important problematic similarities:
1. Neither has any stated empirical follow-up to justify continued "Zero compliance" or evidence that federal benchmarks are being maintained. Maintaining the progress is critical or the achievement is a little hollow.
2. Both use the phrase "ending homelessness" which is affront to veterans who remain homeless in a jurisdiction making the claim. Can we claim DV shelters "end DV"?
3. Neither has a systematic external review by an outside evaluator especially a review of the annual PIT count which should reinforce outreach efforts have engaged all veterans.
If these initiatives are to continue, more rigor is needed to support the pronouncements of "ending homelessness." The NHIP continues to monitor homeless counts of cities and states that have claimed to end veteran homelessness.
* * * * * * *
(published September 2016)
State of Oregon PIT counts rises 5% since 2015
Recently released 2017 PIT Statewide Data from Oregon revealed a 6% increase in homelessness from 2015 to 2017 with the total count rising from 13,176 to 13,953. Oregon PIT Data are posted on public tableau and available to view by County. Oregon's increase follows the general trend of increases in west coast states.
The rise in Oregon's PIT estimates were led by an 8% increase in unsheltered persons rising from 7,357 to 7,967. Reports from the Balance of State Continuum covering 28 counties reported an overall 7% increase with 8 BOS counties experiencing significant increases of between 40% to over 300%. In addition, four medium sized BOS counties (Coos, Columbia, Josephine, Klamath) reported decreases between 24% to 50% from 2015 to 2017.
The NHIP continues to advise people that large one or even two year count differences are often due to methodological differences in the counts not actual changes unless specific interventions can be identified that caused such an increase or decrease. The Oregon study points out problem with completing unsheltered counts throughout its many urban and rural counties.
* * * * * * *
Data from 32 CA Continuums show 14% increase
Data compiled by the NHIP show a 14% increase among the 32 California Continuums who have publicly released their 2017 Point In Time data. Although a majority of CoCs report decreases, increases often quite large from heavily-populated urban areas particularly in the Bay area and Los Angeles County fueled the increase from 110,794 in 2016 to 126,856 in 2017. The remaining eight (8) CA CoCs not reporting are relatively small and would likely not impact the final difference.
The State of Washington has also reported a 5% increase since 2016 bringing their total close to 22,000. Reports from Portland and Eugene, Oregon also report substantial increase. It is likely that all three Western states will show increases when totals are finalized.
* * * *
Updated: Results to Date from 2017 Point-in-Time Count
The following communities have publicly released their 2017 PIT count estimates. The deadline has passed for submission of PIT and HIC information into the HUD Exchange. Communities appear more reticent to release information publicly compared to last year. HUD now weighs progress toward reduction of the PIT count in its annual competition for McKinney Vento Homeless Assistance Funding. Communities that have released counts include the following:.
Decreasing Homelessness
- The state of Kentucky reported a 4% statewide decrease to 4,025 in 2017.
- Chicago FINAL PIT report reported a 3% decrease in total homeless although unsheltered rose 22%
- Contra Costa PIT 2017 report found a 7% decrease with a total of 1,607 compared to 1,730 in 2016. Veterans count declined from 136 to 99.
- Charlotte/Mecklenburg County decreased 12% from 2016 although unsheltered homelessness increased from 185 to 217. Download Charlotte 2010-2017 Report.
- Roanoke, VA (Blue Ridge Area) - Reports a 19% decrease from 331 in 2016 to 267 in 2017. 2017 Blue Ridge Report and Five-Year Blue Ridge Report available.
- Tarrant County (Ft. Worth, TX) - Slight decrease of 0.7% from 1,938 to 1,924.
- Topeka, KS - Down from 417 to 365 in 2017.
- City of Detroit down from 2,335 in 2016 to 2,078 in 2017.
- State of Connecticut down 13% from 3,911 to 3,387.
- Washington DC - Down 10.5% from 8,350 to 7,473. Read the Summary PIT 2017 Fact Sheet.
- Santa Rosa/Petaluma/Sonoma County CoC. CA-504 totalled 2,835 down 2% from 2,906 in 2016.
- Ventura County, CA - Down from 1,271 to 1,152 in 2017.
- New Bedford, MA - Down 25% primarily due to closure of transitional shelters.
- Pierce County, WA - Decreased from 1,762 to 1,321
- Ann Arbor, MI - Down from 342 in 2016 to 300 in 2017.
- Fairfax County, VA - Down from 1059 in 2016 to 954 in 2017.
- San Bernardino, CA - Down 1% from 1,887 to 1,866.
- Barnstable County (Cape Cod MA) - Down 70 persons.
- Hawaii (Neighbor Islands) - 31% reduction in unsheltered homelessness. Possible methodological changes may have augmented arge decreases in "street" counts.
- Austin, TX - Overall 5% decrease in one-day count.
Increasing Homelessness:
- Texas Balance of State 2017 PIT report shows an overall 18% rise in homelessness including a 49% rise in one-day unsheltered homeless.
- Tulsa reported a 2% increase in from 811 to 824. Unsheltered homelessness rose from 150 to 174 person.
- New York City reported a 39% rise in unsheltered homelessness.
- Santa Cruz - Up 14.5% from 2015. Veterans rising over 50%. See Santa Cruz PIT report.
- Sacremento - Up 30% from 2015 to 3,665 from 2,822 in 2015 including over 2,000 living unsheltered.
- Oakland/Alameda County - Up 39% from 4,040 to 5,629. See 2017 PIT Results Brief.
- San Francisco - Increase in veterans/chronic homeless/single adults. Decrease in youth/families. Overall count nearly identical to 2015. See 2017 PIT Results Brief.
- Dallas, TX - Increase in unsheltered from 739 to 1,087. Overall small decrease of 0.6% from 3,810 to 3,789.
- Orange County - Up from 4,319 in 2016 to 4,792 in 2017.
- Wichita/Sedgwick, KS - Up 0.7% from 571 to 575. Veterans up from 45 in 2016 to 57 in 2017.
- Seattle/King County - Overall increase of 8.5% with 22% rise in unsheltered persons.
- State of Washington - Statewide count of 21,843 up from 20,827 in 2016.
- Los Angeles County - Up 23% to 57,794 persons. Unsheltered increase 8,000+ and sheltered increased 2,500+ since 2016.
- Maricopa Couny - Unsheltered Homeless increased to 2,059 up from 1,646 in 2016. Veterans homeless up 9% to 489 persons. Chronic homelessness up 26%.
- Pasadena, CA up 575 up from 530 in 2016.
- Central Oregon count up 31% from 2015 to 778 persons
- Statewide Vermont count up 19% to 1,225 persons
- Naples, FL (FL-606) up from 545 in 2016 in 621 in 2017.
- Riverside County, CA - Up from 2,165 to 2,413 in 2017
- Snohomish WA - Unsheltered count rises from 471 to 515.
- Grand Rapids, MN - Increase over 2016 from 71 to 155.
- Hawaii (Oahu) - Increase of 0.5% over 2016 including a 7% increase in unsheltered homelessness.
- Merced County (CA) - 12.5% decrease in total homelessness. Only 17 unsheltered veterans total.
*******************************************************
Survey Results: Transitional Housing Conversion popular; 73% say Chronic Homeless definition problematic
The NHIP recently asked readers their opinion on different aspects of homeless and housing services on a 15 question survey. The full SURVEY RESULTS Part 2 are available. Highlights of the results include:
- 71% of readers agree that most or some of a CoCs Transitional facilities should be converted to Permanent Housing.
- 23% of readers feel the Chronic Homeless definition is ridiculous to implement. An additional 50% believe it misses chronic people since it is too difficult to implement.
- 82% of readers believe individuals living doubled-up should be considered homeless either always (21%) or depending on circumstances (61%).
- 59% believe emergency shelters should never charge fees.
- 63% believe emergency shelters should not be required to have cots/bed frames in order to eliminate the practice of people sleeping on mats on the floor.
- 43% believe homelessness can be ended with sufficient resources and collaboration.
- 21% believe agree that there should be a category of "super-chronic" to denote people homeless for 5 or more year.
Updated findings from the initial SURVEY RESULTS Part 1 are also available. A total of 255 persons completed Part 1 and 98 persons completed Part 2.
Survey Part 2 is still open for persons wanting to respond.
* * * * * *
Published 03.25.17
NHIP estimates over $10 billion spent annually on homeless facilities
The NHIP has completed a State-by-State and Continuum-by-Continuum analysis of the estimated total spending on homeless facilities including emergency shelters, transitional housing, safe havens, permanent supportive housing, and rapid rehousing units. The estimates use the total number of facilities as listed on the 2016 Housing Inventory Chart for each Continuum. Facility bed costs are estimated per bed or unit and use general estimate from a review of existing literature and experience at several Continuums throughout the country. The NHIP analysis estimates that more than $10 billion is spent from federal, state, local and private sources to operate these facilities
NHIP took estimates of the annual cost of each type of facility and the number of facilities (beds or units) listed in the 2016 Housing Inventory Charts. Some CoC costs are hand-adjusted using a cost-of-living factor ranging from 0.85 (e.g. rural Louisiana, Tennessee) to 1.35 (e.g.New York City, San Francisco). Cost of facilities vary widely, especially emergency and transitional shelters. There is no comprehensive literature available that contains accurate unit costs by Continuum area and facility.
The NHIP used the following annual cost assumptions of the major types of HIC facilities based on existing estimates and experience working in several Continuums:
1) Emergency Shelter Bed for single adult ($18,000)
2) Emergency Shelter Unit for Family ($30,000)
3) Transitional Housing Unit ($15,000)
4) Save Haven Unit ($35,000)
5) Permanent Supportive Housing Unit for single adult ($12,000)
6) Permanent Supportive Housing for Family ($18,000)
7) Rapid Rehousing unit assistance for single ($4,000)
8) Rapid Rehousing unit assistance for family ($6,000)
The NHIP does not make any claim of accuracy especially at the Continuum level. The NHIP does feel that the true number is likely between $8 to $12 billion annually. This estimate provides a starting point for more comprehensive estimates using actual budget data. Validation could be determined if a Continuum or State wishes to add budgets for homeless residential services in their jurisdiction.
There are many issues to think about when determining costs including the fact that many services and costs are often provided free such as free rent or low cost building expenses and free or low-cost meal provision through in-kind services. For readers interested in changing some of the cost assumptions and re-running the analysis for their Continuum or State, NHIP can provide the full spreadsheet upon request.
This total does not include non-residential homeless services that are not listed on the Continuum Housing Inventory Chart Including federally-funded PATH Outreach funding ($65 millIon, Health Care for the Homeless funding ($400), non-residential HOPWA funding, and other initiatives that would put the total amount of federal, state, and local spending over the $11 billion mark.
The NHIP welcomes feedback on this analysis.
* * * * *
Survey Results: 1/3 feel homelessness is getting worse; Only 25% think street counts within 10% of accuracy
A total of 235 respondents (thank you!) completed the first NHIP 10-item survey covering opinions on important subjects within homeless services. The full report contains a complete breakdown by question. Click on survey (right) to read and download. Key highlights of the survey include:
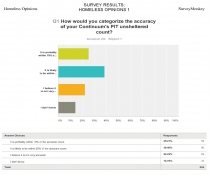
- 43% feel the unsheltered count should occur with greater frequency than annually. The current HUD mandate is every two years.
- 20% agreed that persons living in Transitional Housing should not be considered homeless.
- 31% feel there is too much emphasis on chronic homelessness funding.
- 65% feel that HUD is definitely (17%) or somewhat (48%) on the right track.
- 11% think that Transitional Housing should receive no federal funding.
The intent of the NHIP is two-fold: 1) To track attitudes from key stakeholders working in the homeless field, and 2) To use questions to elicit different ways of thinking about key axioms guiding homeless services (e.g. Should people in DV shelters or Transitional Housing be defined as homeless?)
While the survey sampling is not methodologically rigorous, the NHIP does feel that given the number of respondents and the distribution of readership of the NHIP across the country, there is a good likelihood that results reflect the attitudes of people working at the management level of homeless services in the U.S.
Published 02.23.17
* * * * * * * *
Published 01.23.17
Will the Senate Housing Appropriations Committee house their 44,000+ homeless constituents?
Homeless estimates in the home states of the Senate Appropriations Subcommittee that controls funding for homeless services shows that the one-day prevalence of the Senators constituents with serious mental illness who are homeless is over 44,000. The list includes:
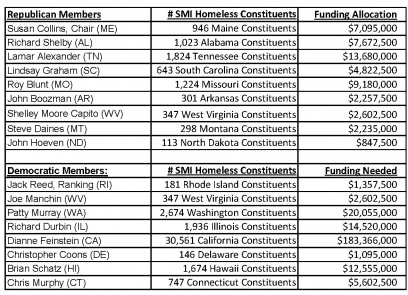
Additional funding of $450 million is needed to fund 22,000 new Housing vouchers. The chart above shows an estimate amount of funding that would be distributed to each of the Senator's states if the needed funding were approved. The State of California has tremendous need due to continuing growing population of homeless persons with serious mental illness.
In FY16, a $250 million increase in funding was coupled with a transfer of $200 million in CDBG million to cover the needed HUD funding increase for chronically homeless persons, the majority of whom have serious mental illness.
The NHIP estimates that a minimum of 40,000 new vouchers for SMI homeless experiencing chronic homelessness are needed using the same successful strategy that has cut chronic homeless among veterans by more than 50% in the past 6 years.
* * * * *
Vouchers for SMI Homeless critical to ending long bouts of unsheltered homelessness
Homeless estimates from the annual HUD application reported a total of 45,000+ persons with serious mental illness (SMI) who were experiencing unsheltered homelessness on any given day. A total of 14 CoCs reported more than 500 SMI homeless persons. See table below. For a completed breakdown, CLICK HERE for the full report.
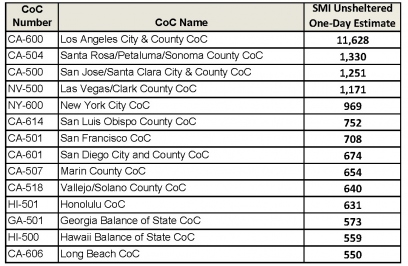
A total of 9 CoCs from California were among the 14 with 500 or more SMI homeless. Both CoCs in Hawaii were also represented as well as CoCs from New York City, Las Vegas, and BOS Georgia.
The NHIP has estimated a minimum need of 40,000 vouchers specifically for chronically homeless persons with serious mental illness. In comparison, the VA-HUD VASH initiative has provided over 87,000 vouchers for homeless veterans. When the VASH initiative began in 2009, estimates of one-day veterans homeless prevalence ranged between 80,000 and 100,000. Using this simple comparison, the NHIP estimates the need for 40,000 new vouchers and reassignment of additional 40,000 vouchers as they turnover in current PSH programs.
A review of the SMI prevalence also revealed a large variation between CoCs in the percentage of unsheltered homelessness that are estimated to be seriously mentally ill. Below are the select CoCs with very high and very low SMI percentages.
High Prevalence Lowest Prevalence
1. CT-503 Bridgeport - 86.5% 1. WA-500 Seattle 4.4%
2. CA-504 Santa Rosa - 69.8% 2. FL-509 Fort Pierce 5.8%
3. KY-501 Louisville - 68.8% 3. CA-503 San Diego 13.6%
The average estimated prevalence of SMI across all Continuums is 25.7% for unsheltered homeless persons and 16.5% for sheltered persons. NHIP recommends that Continuums who have a prevalence much higher or much lower than the national average review their estimation procedures. The use of untrained volunteers or staff to collect data during Point In Time counts reduces the ability to do estimation procedures with any accuracy.
* * * * * * * * * * *
Published Jan 11, 2017
NHIP "Purchasing Power" Analysis: High FMRs reduce True Homeless Funding level for high-cost areas
The NHIP has completed an Analysis on 50 Select Communities that adjusts HUD funding for the cost of housing using the 2016 studio FMR rate. Since HUD funding essentially pays for rental assistance, adjusting the funding by the cost of housing produces a "Purchasing Power" level which can allow for a better comparison of the ability of funding to reduce homelessness. .jpg)
Top Five Communities impacted
by Purchasing Power reductions:
1. New York City (-$57.6 million)
2. Los Angeles (-$38.5 million)
3. Chicago (-$19.6 million)
4. San Francisco (-$18.3 million)
5. Seattle (-$14.7 million)
Adjusting Homeless Per Capita Funding (Funding divided by PIT Count) using the new Purchasing Power funding levels yield even greater disparities between high cost areas with high homeless prevalence. The table below shows select communities with the highest and lowest funding levels after controlling for purchasing power. The average level of Funding Per Capita is $3,522.
Lowest PP-adjusted Funding Per Capita
1. New York City ($678)
2. Honolulu ($854)
3. District of Columbia ($1,165)
4. San Diego ($1,214)
5. San Jose ($1,366)
Highest PP-Adjusted Funding Per Capita
1. Wilkes-Barre ($31,826)
2. Cincinnati ($18,453)
3. Cleveland ($18,113)
4. Pittsburgh ($16,605)
5. Ann Arbor ($13,081)
Currently, the HUD funding formula does not take into account the cost of housing. There is also no effort to connect persons living homeless in high cost areas to lower cost areas, a strategy used by many non-homeless households. HUD new FMR standards will actually allow many communities to use even higher FMR levels to allow for increased deconcentration of PSH units.
Currently, HUD rent rules do not provide any incentive to recipients to choose lower cost housing since recipient rent is based on their income not on the cost of housing. The NHIP feels this is a one of the fundamental flaws of the rent regulations.
The NHIP recommends HUD rule changes to incorporate normative alignment of rental housing regulations including great portability of subsidies, non-linkage of rent to income, elimination of the 30% rent rule which provides a great disincentive to form multi-earner households, and specifically allowing HUD housing subsidy recipients the right to share their housing with family or friends without impact to rent or compliance.
The NHIP believes that HUD policies since the 1960s - particularly the 30% rent rule and its regulations - are responsible for much of modern homelessness and housing instability.
Analysis of 2016 Homeless Funding compared to Homeless Prevalence
A new NHIP analysis comparing HUD homeless funding awards with the most recent estimates of homelessness shows continued large disparities among Continuums reinforcing the need for HUD to adjust funding for communities significantly underfunded.
The NHIP created two adjusted funding measures: 1) Measure 1 represents Funding Per Homeless Person by dividing the HUD homeless funding award for the CoC by its PIT homeless count; 2) Measure 2 represents Funding Per Homeless Services by dividing the HUD homeless funding award for the CoC by its PIT homeless count plus its PSH count. Since more than 70% of homeless funding supports PSH units, a measure incorporating these totals is needed to give a more balanced picture. Taken together, these two measures offer the ability to identify communities with sigificant underfunding compared to its peer Continuum.
Measure 1 produced an average funding level of $3,531 with a high of $23,180 in PA-503 Wilkes-Barre/Hazelton/Luzerne and a low of $3.55 in CA-524 Yuba/Sutter. Measure 2 produced an average funding level of $2,180 with the high of $8,027 in PA-503 and a low of $3.55 in CA-524. The report table is sorted by Measure 1. Below are the top 20 most "underfunded" large Continuums (CoCs with more than 1,000 homeless):
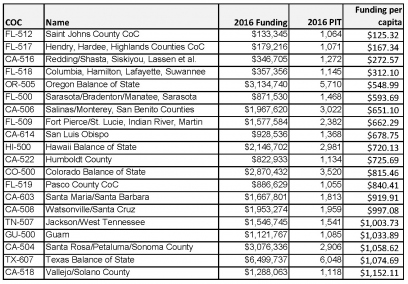
A review of the top twenty "most underfunded" is populated with many CoCs from California (8) and Florida (6) in addition to two other West Coast/Pacific Continuums.
Continuums that continue experience increases in homelessness also showed Measure 2 levels well below average including Hawaii BOS ($625), District of Columbia ($1,421), and San Diego ($1,423) .
The NHIP will provide additional analysis on funding levels in the coming weeks.
* * * * * * * * * * * * * * * * * * * * * * * *
Published 12.20.16
Homelessness among Adults with Serious Mental Illness rises
In the latest 2016 estimates for one-day homelessness collected in January 2016, data show a rise of 3.6 percent in the estimated prevalence of homelessness among adults with serious mental illness (SMI). The 2016 estimates from 402 Continuums across the country totaled 107,801 compared to 104,083 in 2015. Increases in sheltered and unsheltered homelessness among SMI persons were reported with a total of 61,846 in emergency or transitional shelters and 45,955 living in the streets, parks and other places not fit for human habitation.
The NHIP has compiled a state-by-state prevalence report from the individual subpopulation reports. The report also calculates the SMI prevalence as a percentage of total one-day homelessness. HUD has not provided a comparison chart for homeless subpopulation estimates.
Eight states led by California, Florida, Hawaii, Nevada, New York, Oregon, Texas, and Washington reported a one-day SMI unsheltered homeless count of 1,000 or great. California had by far the highest number of SMI unsheltered homeless with a one-day estimate of 24,269 followed by Florida with 2,791.
The State of Maine reported the highest percentage of SMI homeless among all homeless persons at 42.2 percent, while South Dakota had the lowest estimated prevalence rate of 7.7 percent. Overall, the national average is estimated at 19.6 percent of all homeless, with a sheltered rate of 16.6 percent and unsheltered rate of 26.1 percent.
Estimates of seriously mentally ill are generally thought to undercount the true prevalence since PIT estimates generally rely on self-reports. Serious mental illness includes schizophrenia, schizo-affective disorder, bipolar depression, post-traumatic stress disorder, and major depression.
The NHIP has called for the creation of 40,000 new Permanent Supportive Housing vouchers at an annual cost of $500 million to reduce by half the prevalence of SMI homelessness.
Published 12.05.16
Homeless Increases Skew toward the West Coast/Pacific
A new NHIP Report using recently released HUD data on 2016 Point-in-Time sheltered and unsheltered homeless estimate show that 13 of the 15 Continuums with the largest increases in unsheltered homeless are all from West Coast/Hawaii states or those neighboring (Idaho or Arizona). The 15 areas include:
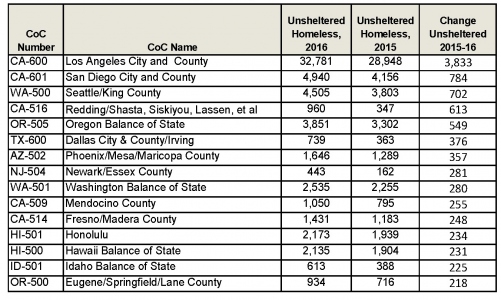
These fifteen areas reported a combined 9,186 increase from 51,550 in 2015 and 60,736 in 2016 for an overall increase of 17.7%.
The report revealed that among all 402 Continuums, 150 CoCs reported increase with 251 CoCs showing decreases in overall one-day homeless estimates. Unsheltered estimates which experienced an overall increase of 1.8% featured 163 CoC with increases and 173 with decreases. Sixty-six (66) reported no change, with almost all using 2015 data due to the lack of count in 2016.
Many CoCs like Honolulu and San Diego have been ata the top of lists of as areas receiving significantly less funding compared to their homeless prevalence. The NHIP plans to do additional analysis comparing funding per capita and homeless estimate changes.
Published on November 22, 2016
2016 PIT Skinny: Sheltered, Vets, Chronic Down; Unsheltered Non-Vet Homeless Up 4%
The U.S. Department of Housing and Urban Development has published comprehensive tables on the 2016 PIT count estimates from each of the 400+ CoCs around the country.
Data reported show an overall 2.6% decrease in one-day homeless estimates (564,708 to 549,928) from 2015 to 2016 with a 4.6% decrease in sheltered homelessness and 1.8% increase in unsheltered homelessness. The NHIP notes that the HUD-reported 2.6% decrease is identical to the decrease reported by NHIP in mid-summer after collection of a 30% sample of CoC reports.
Overall, 15 states led by Idaho (14%) and the District of Columbia (14%) reported an increase in total overall homelessness. Other states reporting large increases included Delaware, Oklahoma, Colorado, Washington, Rhode Island, and Hawaii. Among the 39 states and terrorities that reported decreases, North Dakota (-29%) and Vermont (-27%) and West Virginia (-24%) led the way.
Homeless veteran counts continue to decrease with a 17% drop from 47,725 in 2015 to 39,471 in 2016. The massive funding through VASH and VA service connected increases has been a key factor in addition to the lower overall prevalence of veterans in the nation.
The NHIP reports that Persons who are Not Veterans experienced only a 1.3% decrease from 516,983 in 2015 to 510,457 in 2016, less than half the total national increase. Unsheltered prevalence of non-veterans rose by 4% from 157,048 in 2015 to 163,290 in 2016.
The NHIP will be providing additional reports and analyses using the newly released data at the State and CoC level in the upcoming months. As always, the NHIP welcomes suggestions on reports.
Originally published 11.21.2106
Chronic Homeless Prevalence Estimates Report shows wide State-by-State Variation
In the first analysis using newly published 2016 PIT Homeless , the NHIP compared the percentage of chronically homeless persons as a percent of the report one-day homeless counts.
Overall, 16% of homeless persons were identified as chronic with chronically homeless persons representing 8% of sheltered persons and 32% of unsheltered persons. Variation in the chronic prevalence among the 54 states and U.S. Terrorities showed a range between 4% to 40%. Sheltered chronics ranged from 0% to 21% and unsheltered chronic prevalence ranged from 4% to 75%.
Variation in chronic prevalence can be a marker for several issues: 1) Lack of consistent methodology used by CoC across the country, 2) Differential mix in the types of homeless facilities in a state, 3) Real differences in population characteristics, and 4) General unspecific errors in tabulations by CoCs and States.
Prevalence rates that fall outside one standard deviation of the average (total 9% to 23%; unsheltered 18% to 46%) should be reviewed for all the above potential threats to accuracy. The NHIP will complete comparisons at the CoC level in the next week.
It is critical for CoCs to correctly identify persons who are chronic as Coordinated Entry Systems using the HUD Orders of Priorities are being implemented across the country.
Originally published 10.21.16
NHIP publishes State of Florida Homeless Report
In partnership with the Florida Coalition for the Homeless, the NHIP has published the "State of Florida Report: 2016 Homeless Census Estimates and Funding Need to End Chronic Homelessness". The report was presented at the recent FCH Conference in Orlando, FL on October 5th.
The report contains data from each of 27 FL Continuums and presents census estimates on all major demographic groups including total homeless, sheltered, unsheltered, veterans, and chronically homeless persons. Comparisons with 2015 data are included for many data tables. The report also presents population prevalence rates of homelessness.
Data show a 7 percent decrease in total homelessness from 35,900 in 2015 to 33,466 in 2016. Veterans homeless fell 35% from 3,926 to 2,902
A highlight of the report is an estimate of the need for additional permanent supportive housing beds for each of the 27 Continuums in order to end chronic homelessness in their community. The report estimates a need for 2,991 beds at a cost of $34 million annually.
Updated Sept 15, 2016
NHIP: It's the Funding Level, Stupid !
Response to Open Comment on funding formula
The NHIP has formulated a response to the HUD Open Comment period concerning the funding formula. The response contains four key recommendations:
1) HUD should solicit comments on modifications to ARD funding not PPRN funding which has only limited impact.
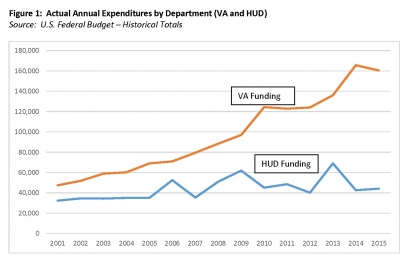
2) While VA funding has increase 350% since 2001, HUD funding has increase only 27%. Substantial funding increases must be advocated including the creation of 40,000 vouchers for chronically homeless individuals.
The NHIP reminds that the systemic problem is a lack of funding. The figure belows shows the increase in VA funding that has been the primary engine to reduce veteran homelessness.
3) Allocation of Continuum Homeless Assistance funding should use the following five (5) indicators:
30% Current ARD
20% HIC bed count (ES,TH,SH,PSH,OPH)
20% Unsheltered count
15% FMR
15% Level of new homeless entry
4) Allocation of Continuum Planning dollars should provide a minimum of $25,000 with a reduced percentage for CoC ARD amounts above $10 million.
HMIS Vendor Distribution for CA and FL
The NHIP has collected information on HMIS choices for two (2) of the larger states - California and Florida. A big thank you to Joe Colletti at Urban Initiatives for providing the CA listing and the Florida Homeless Coalition for its state listing. 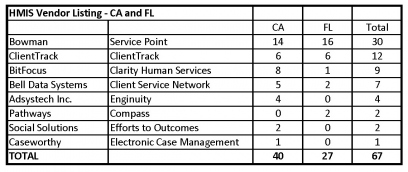 A written request to HUD in June 2016 for the complete HMIS vendor listing for all 400+ CoCs was not answered. The NHIP welcomes other states (especially large states) and individual CoCs to send their vendor distribution. More competition for HMIS software helps make better choices for agencies.
Updated 08.10.16
More Scores Posted! CoCs share scores and debriefs
The NHIP received several responses to its request last week asking CoCs to share HUD scoring of their 2015 application. Three high-scoring Continuums - Philadelphia (PA-500), Springfield-Hampden (MA-504), Omaha-Council Bluffs (NE-501) - have given the NHIP permission to publicly release their scores (coupled with their applications). NE-501 has also made available the detail of their scoring. Two additional CoCs also provided their application score.
1) Kings/Tulare (CA-513) - Score of 160.75 (not bad!)
2) Philadelphia (PA-500) - Score of 168.5 (good going!)
3) Springfield-Hampden (MA-504) - Score of 179.5 (impressive!)
4) Omaha-Council Bluffs (NE-501) - Score of 184 (debrief) (silver medal?). NE-501 is featured under "Know Your Continuum" on the NHIP website..
5) BOS Hawaii (HI-500) - Score of 149.5 (And its Hawaii!)
6) Charlotte/Punta Gorda (FL-602) - Score of 130.5 (it is a great vacation spot !)
7) BOS West Virginia (WV-508) - Score of 153 (debrief)
8) Dallas /Irving(TX-600) - Score of 139 (debrief)
9) Louisville (KY- 501) - Score of 157
10) Santa Ana/Anaheim/Orange (CA-602) - Score of 160 (debrief)
We encourage more Continuums - both high and lower performers - to share their scores and applications from 2015. We will add to this posting as we receive additional scoring information.
The Houston Coalition also confirmed to the NHIP that they did receive the high score of 188. The NHIP could not find a copy of the application on the the Houston Coalition website. HUD posted that the median score was 150.
The NHIP wishes all CoCs success on their upcoming applications! As always, if the NHIP can be of any help, please contact.
HUD solicits Comments on Homeless Funding Formula
On Thursday, July 21st, HUD released its OPEN COMMENT solitation on the Continuum Homeless Funding Formula. The following set of documents accompanies the announcement:
- Federal Register Explanation Narrative - MUST READ!
- Excel-based Alternative Funding Tool - Designed by HUD to show funding scenarios based on weighting of HUD-selected funding factors.
- HUD-produced Alternative Funding Scenarios with amounts for each of the 400+ Continuums.
Initial NHIP comments include:
Critique 1: HUD is requesting comments on PPRN amounts NOT the Annual Renewal Demand (ARD) which is the effective CoC funding level. It is unclear how modifications of an adjustment to the PPRN will significantly impact funding for the vast majority of Continuums. See example below:
EXAMPLE 1: CIty and County San Diego
1. Current PPRN: $13,323,923
2. HUD Alternative Scenario #1: $16,840,372
3. HUD Alternative Scenario #2: $16,673,326
4 . HUD Alternative Scenario #3: $15,738,952
5. HUD Alternative Scenario #4: $16,628,640
6. Current 2016 ARD: $17,363,919
Critique 2: HUD specifically in the federal register states that it does not believe current PIT counts (either sheltered/unsheltered or a combination or transformation) are reliable enough to be used for funding allocation purposes. The NHIP specifically believes this to be untrue and short-sighted and that PIT counts can be incorporated given simple data transformations to adjust for the fact that unsheltered counts are known to be estimated (with error increasing as estimates rise) with varying degrees of quality.
EXAMPLE: CIty and County San Diego
Funding based on Homeless Prevalence
1) NHIP estimate: $22,267,919
2) HUD estimate: $24,661,182
Critique 3: HUD's excel-based scenarios are very limited since only HUD selected factors are included. Impacts for cities with significant underfunding are not significantly altered, magnitude-wise or in comparison with other cities. By the doing, it is limiting the ability of advocates to provide strong evidence for use of different factors.
Critique 4: While HUD states that PIT counts are not reliable enough, it employs these very rates in its statistical correlation analyses to justify its own factor choices.
In the coming weeks, the NHIP will provide additional information and analyses for Continuums and communities to help them craft responses to the Funding Formula. The OPEN COMMENT period is for 60 days or approximately September 20th (pending confirmation of publication date).
The NHIP acknowledges the work of Rep. Scott Peters (D-CA-52) and his staff on advocating for changing the formula over the last three years.
(posted 07.19.16)
What is the true cost of reducing Veteran Homelessness?
As communities push for achieving Functional Zero for veterans, it is important to understand and document the true total cost of achieving these reductions. Underreported in the media and undeniably an important factor is the tremendous increase in benefits compensation awarded by the VA since the campaign to end veteran homelessness began in 2009.
The recent NHIP veterans compensation analysis reports that from 2010 to 2015 the number of veterans receiving disability compensation rose from 3.2 million to 4.2 million including over 250,000 Vietnam veterans receiving benefits for the first time. In addition, the average annual disability compensation has risen from $9,400 in 2006 to $14,400 in 2015. Currently, nearly 1 in 5 veterans receive service-connected disabilities..jpg)
In 2015 alone, approximately 95,000 veterans were newly awarded service-connected benefits at the 70% to 100% degree level. A total of 313,000 veterans received first time benefits in 2015 totalling $3.62 billion, The VA disability compensation budget has more than doubled over the past six years from $50 billion to over $100 billion.
This voluminous increase in spending on veterans disability benefits must be understood within the context of reducing homeless prevalence among other important subpopulations. While SSI benefits to non-veterans have increased over the years, the rate is far less (single digits) and the federal SSI awards currently $733 per month equal only a 50% service-connected combined degree.
The direct VA homeless budget, listed at $1.6 billion annually, is as large as nearly two-thirds of the recently announced 2016 $2.5 billion HUD homeless services budget. If the veterans population represents only 15% of the total homeless population, then common sense would dictate that funding to reduce homelessness among the severally mentally ill and other key populations would need a budget at least three-fold and as much as six-fold the current HUD Homeless Assitance budget. The VA and HUD created and maintains 70,000+ vouchers for veterans at a cost approaching $1 billion alone. Wouldn't at least 200,000 new vouchers be required for non-veterans? Isn't a minimum increase of $3 billion needed?
The silence among leading advocacy groups for a significant increase in funding for non-veterans has always been troubling. The CoC budget has barely doubled in the past 15 years. Needless to say, homeless service workers pay is relatively flat as well hurting the system further by making it ever difficult to attact the talent needed. Taking away the reduction in veterans homelessness, homeless prevalence is relatively flat over the past few years.
If success to reduce veterans homelessness is to be proclaimed, it must be understood that TREMENDOUS INCREASES in funding that are as big as the entire $48 billion HUD budget have been a driving force. If significant gains among the non-veterans population are to be seriously targeted, then serious commitments are a prerequisite.
Michael Ullman, Ph.D.
NHIP Coordinator
PIT UPDATE: Count down 2.6% with 144 CoCs reporting
With information collected from 136 Continuums, results show an estimated national decrease of approximately 6,500 compared to the 2015 count. Results from publicly-released one-day counts held in January 2016 report a total of 240,797 homeless persons compared to 247,171 from the same communities in 2015 for an overall 2.6% decrease.
The Homeless Action of Detroit (HAND) reported a 10% overall decrease from 2,597 in 2015 to 2,335 this past January. Detroit experienced an increased in unsheltered from 151 to 193 while sheltered persons decrease 12% from 2,446 to 2,142.
Other recent reports include the South Carolina 2016 report from the SC Coalition for the Homeless representing the state's four (4) Continuums estimates an overall reduction from 5,354 to 5,050 including an 11 percent reduction in unsheltered homelessness from 1,897 in 2015 to 1,689 in 2016.
Data from the Institute for Community Alliances (ICA), the HMIS lead for the State of Alaska, showed little change in statewide totals (1,956 in 2016 compared to 1,940 in 2015) although the Anchorage CoC total fell 9% while the BOS rose 12%. The ICA become the lead agency during the past year and did not conduct the 2015 PIT count. Conclusions about trends using the 2015 data are not recommended by the ICA.
For a complete listing of the PIT 2016 results collected to date CLICK HERE.
Originally posted 06.06.16
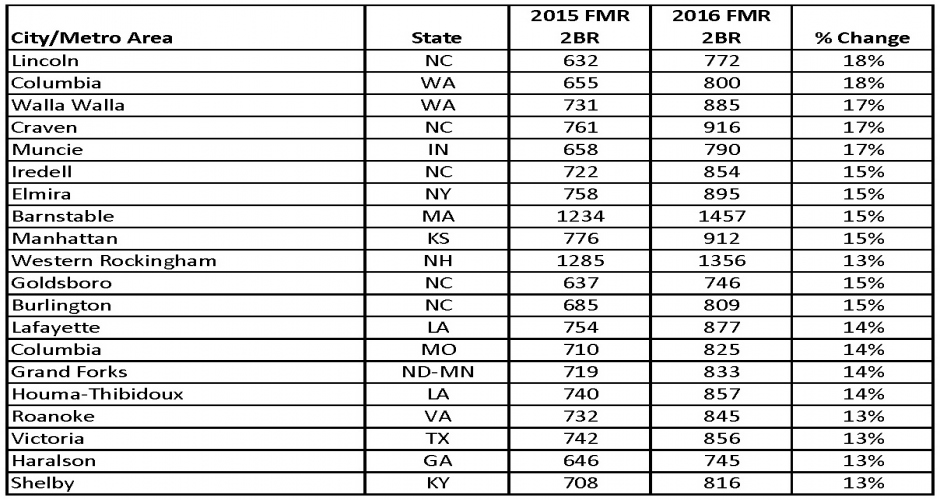
FMR rates rise further in already high-priced cities
An NHIP analysis of the change in FMR rates from 2015 to 2016 showed an estimated 4% average increase across the 4,500+ areas in the nation. A review of the 20 most expensive metro areas revealed very large increases among a majority, including San Francisco, New York City, and Honolulu. FMR rents for a few cities including Santa Cruz and the suburbs of NYC were adjusted downward. The table below provides details on the 2BR FMR rate change for the 20 areas.
.jpg)
Among all areas with HUD FMR rates, the estimated average 2BR FMR is $800 with two-bedroom rates below $600 in non-urban areas of Louisiana, Alabama, West Virginia, and Tennessee. The middle two quartiles (from the 25th to 75th percentiles) ranged from $659 to $934.
The 20 fastest rising FMR rates in 2016 (chart below) included multiple areas in North Carolina and growing areas in the State of Washington and Lousiana. FMR rate adjustments typically lag actual rent change by one year or longer. Increases in FMR rates also require increases in HUD funding for grants for lease costs like Permanent Supportive Housing to ensure that subsidies can be maintained as rents rise. Due to the HUD rent formula, clients are not required to pay more in rent since payments are tied to client income not actual rental costs.
The NHIP would like to thanks Matt Simmonds of SimTech Solutions for sending us the FMR comparison file for review.
**************************************
And the HUD Funding Winner is. . .CA-507 Marin County!
Using a ratio of the current Continuum ARD funding level and its PPRN amount, the NHIP has developed a measure to assess the success of Continuums in securing funding through the annual McKinney-Vento homeless assistance awards.
In the past decade, HUD has initiated a more competitive process for Continuum funding. The ARD/PPRN ratio provides an empirical tool to assess how successful Continuums have been in securing bonus awards and priotizing housing projects that can increase its ARD. In general, the higher the ratio, the better the Continuum has performed in the funding competition. The PPRN essentially serves as a baseline funding level, while the ARD is the current funding renewal level of previously awarded projects. The NHIP realizes that additional mitigating circumstances may exist at the Continuum level to explain some of the ratio variance.
The current 2015 ARD total is $1.83 million, while the PPRN total is $1.42 million. The overall ARD/PPRN ratio is 1.28. Continuums with a ratio exceeding the national average have fared better over the past decade in securing funding.
TOP TEN CONTINUUM ARD/PPRN RATIO
1. Marin County (CA-507) Ratio =8.91
2. Mendocino County (CA-509) Ratio=7.79
3. Nashua/Hillsborough (NH-502) Ratio=6.48
4. Charles/St. Mary's/Calvert (MD-508) Ratio= 6.18
5. Garrett County (MD-510) Ratio = 4.83
6. Eaton County (MI-523) Ratio = 4.55
7. Eugene/Springfield/Lane (OR-500) Ratio = 4.37
8. Alexandria County (VA-603) Ratio = 4.14
9. Washtenow County (MI-509) Ratio = 4.09
10. Newburg/Middletown/Orange (NY-602) Ratio = 3.77
For a complete list of Continuum Ratios, CLICK HERE
TOP FIVE STATE ARD/PPRN RATIO
1. Connecticut - Ratio = 2.68
2. Washington - Ratio = 2.29
3. District of Columbia = Ratio = 2.26
4. Maine - Ratio = 2.20
5. Alaska - Ratio = 2.09
For a State-by-State Ratio comparison, CLICK HERE
Note: The Louisiana Balance of State Continuum was not included in this analysis. A preliminary calculation yielded a ratio above 15.0. The NHIP wanted to confirm the information on this Continuum before adding it to the analysis.
**************************************
Originally Posted 04.01.16
NHIP Special Update: State-by-State Ranking of Homeless Assistance "Per Capita" Funding
In response to reader requests, the NHIP has tabulated Homeless Assistance Funding "Per Capita" Rates by State. Per capita funding is a measure developed by the NHIP to assess disparities in federal homeless assistance funding. Per Capita funding is calculated by dividing the Annual Renewal Demand and Planning funding (numerator) by the Point-in-Time Homeless Count (denominator).
The analysis ranks the 50 states, District of Columbia and U.S. Territories from highest-to-lowest homeless assistance per capita funding. Data reveal that the State of Connecticut receives the highest amount of funding per capita with $8,464, while the State of Wyoming receives the lowest with $369. The average funding per capita for the U.S. and its territories is $2,822.
Western/Pacific states, especially those with with low population densities, tend to receive very low per capita funding. Rust belt and Northeastern states represented most of the top funded states.
The report also calculated the amount necessary to achieve an equalized level of funding using the U.S. average of $2,822. The State of Illinois with a per capita rate of $6.675 currently receives $50 million more than it would receive with an equalized funding formula. Ohio would require a reduction of $47 million, while Connecticut would lose $22 million.
Among states with below average per capita funding, New York would require an additional $79 million to achieve equalization, while California and Florida would need an additional $50 million and $27 million, respectively. Wyoming, who has the lowest per capita rate, would stand to gain an additional $2 million in homeless assistance funding.
Many factors impact the level of federal McKinney-Vento homeless assistance funding including the performance of local communities in planning services and reducing homelessness. This analysis offers information that can address wide disparities that may be hindering states’ ability to reduce homelessness, especially when compared to their peers.
***************************************
Originally Posted 03.27.16
NHIP Special Report: Large Disparities in Federal Continuum Funding compared to Homeless PIT Count Prevalence
A comparison between Federal McKinney-Vento funding and Continuum Point-in-Time estimates of one-day homelessness revealed large inequalities in funding "per capita" received by the 400+ Continuums. The report entitled "An Analysis of the Allocation of the Federal Homeless Funding" aims to provide Continuums with information on potential federal funding barriers that may be hindering their progress to end homelessness.
Using 2014 data, the NHIP calculated an average of $2,822 in funding dollars per homeless person enumerated through the PIT across the nation. Continuum "per capita" funding ranged from less than $500 to more than $18,000 with 12 Continuums receiving more than $10,000 in funding. while 60 Continuums received less than $1,000 in funding per capita.
Continuums from West Coast (Hawaii, California) and Sun Belt (Florida) tended to be over-represented among the lower funded Continuums, while Continuums from Northeastern states (New York, Ohio, Pennsylvania) tended to receive high funding levels. The report contains "per capita" rates for all 400+ Continuums.
The NHIP calculated that an equalization of funding would require movement of approximately $500 million in annual funding from high to low funded Continuums. The report strongly recommends that the annual $300 million in "bonus" funding be employed to address large funding inequities between Continuums.
The report develops several diagnostics including a ratio of homeless-to-permanent housing beds to better understand and compare the structure of homeless bed inventories across the nation and its relationship to funding and success in reducing homelessness.
The report recognizes the limitations of the analysis and the problematic nature of all homeless services data.
***************************************
Originally posted 03.14.16
NEW REPORT: Domestic Violence Beds within Continuum
The NHIP has published a new report on the prevalence of Domestic Violence beds within Continuums (as listed on the HIC) and at the State-level. The report provides comprehensive data on the number of DV beds and the percentage of beds desig nated as DV. A total 50,267 or 11.9% of all Continuum Emergency, Transitional and Safe Haven beds as designated for DV survivors.
Key recommendations from the study include requiring Continuum to report separately the domestic violence ned census and utilization in Continuum Point-in-Time counts. The PIT DV counts can augment data currently collected the National Network to End Domestic Violence. Additional recommendations and findings can be found in the report.
The new 2015 NNEDV Domestic Violence shelter count report can be found HERE for comparison. Their annual DV count occurs in mid-September of each year and tallies utilization of shelter and services at over 1,900 domestic violence programs in the U.S.
***************************************
A grassroots collaboration sharing information and knowledge about homeless services