VETERANS DATA REPORTS
Special Report: HUD-VASH Exit Study
Completed by the National Center for Veterans Homelessness, the study examines program usage among over 7,000 veterans from four cities (LA, Palo Alto, Phildelphia, Houston) during the 2009-2014 period including veterans housed under the program, housing and exited from the program, and veterans exited without being housed.
VASH Allocation by Housing Authority as of Dec 2018
VASH Utilization by PHA as of March 31, 2018
VASH Utilization by PHA as of Sept 30th
The NHIP has provided the full listing of all 500 Public Housing Authorities and the VASH utilization and monthly costs for the month of September 2017, the most recent month available. You can look at the PHAs in your area to see the number of VASH units under lease as of the end of September, 2017. Nationwide, 83% of VASH vouchers were leased (72,745/87,697) with approximately 15,000 unused.
TOP 10 LOWEST VASH UTILIZATION (as of Sept 30, 2017) (PHAs with more than 100 vouchers)
1. 40% - Maryland Dept. Of Housing and Community Development (63/159)
2. 41% - City of Oceanside Community Development Comm (45/110)
3. 49% - Indiana Housing and Community Development Authority (190/390)
4. 54% - Housing Authority of the County of San Mateo (184/339)
5. 57% - Housing Authority of the County of Riverside (434/756)
6. 59% - NYC Dept of Housing Preservation and Development (141/239)
7. 60% - New Hampshire Housing Finance Agency (117/195)
8. 62% - Fort Walton Beach Housing Authority (85/137)
9. 65% - Housing Authority of the City of Los Angeles (2,636/4,059)
10. 65% - Bossier Parish Section 8 (Louisiana) (160/246)
Functional Zero Federal Benchmark Generation Tool
The Federal Benchmark Generational Tool provides communities with a macro-based Excel reporting tool that can calculate progress toward the four (4) criteria of reaching and maintaining functional zero.
Veterans Compensation Report - Fiscal Year 2016
Veterans Compensation Report - Fiscal Year 2015
Veterans Compensation Report - Fiscal Year 2010
Special Report: VASH cost by PH A
A
The NHIP has completed an Analysis of the Average Cost of VASH vouchers (lease costs) at each of the 484 PHAs implementing the VASH program. The average cost per voucher per month is $581 with a range as high as $1,345 per month per veteran in Santa Clara County to a low of $225 per month per veteran in Lebanon, PA. Seven (7) PHAs had average monthly VASH lease costs of over $1,000 per unit including six PHAs in the Bay Area of California (Santa Clara, San Francisco, Marin County, Contra Costa, Oakland, San Manteo) and the District of Columbia.
The analysis includes a calculation of annual costs above or below the average rent subsidy for each PHA. The PHA with the highest annual cost of VASH subsidies above average is New York City Housing Authority with an average of $831 per unit and 2,708 units for a total annual costs above average of $7.9 million. The PHA with the greatest "savings" compared to average is the Michigan State Housing Development Authority with an average of $443 per unit and 889 units yielding a total of $1.55 million below average cost.
NHIP Report: VASH vacancy rates among selected Public Housing Authorities
VASH Utilization Report (83 PHAs) as of September 30, 2016
VASH Utilization Report (100 PHAs) as of December 31, 2016
2016 Homeless Veterans prevalence among Zero communities
The table below displays sheltered, unsheltered, and total veteran homeless estimates from the recent 2016 Point-in-Time count for the 29 communities that HUD has announced as having "effectively ending veteran homelessness." Data uses CoC reports for the communities identified by HUD. Two communities did not have reported data since they are cities within large Balance of State or multi-city/county areas.
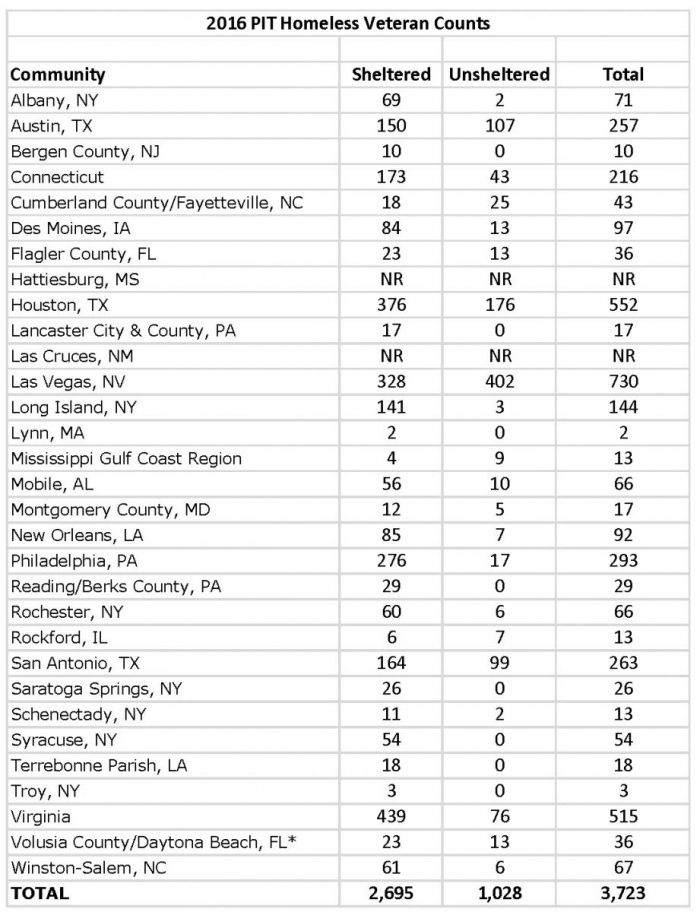
The definition of "ending veteran homelessness" used by HUD and VA officials and adopted by many communities contains many components that cannot be rigorously measured. The definition itself states that "Ending Veteran Homelessness" does not mean there are no homeless veterans in the community, but rather focuses on an assessment that the system has the capacity to serve homeless veterans desiring assistance. While some Zero communities have prevalence magnitude very low (less than 25 total veterans), other communities continue to have substantial levels of veteran homelessness.
Post 08.16.16

New analysis compares equity of new VASH awards with 2016 PIT Veteran Estimates
Nevada, Oregon, Georgia and California among States that appear shortchanged compared to remaining need
The NHIP has completed a NEW STATE-BY-STATE REPORT comparing the number of new 2016 VASH slots awarded with current estimates of veteran homelessness (total and unsheltered) from the recently completed 2016 PIT count. It would be expected that areas with continued high levels of veteran homelessness would receive more new VASH vouchers than areas with low prevalence. A summary of findings includes:
- A total of 5,269 new VASH slots were awarded in 2016 bringing the total VASH to 85,097. Recent 2016 PIT numbers show 39,471 homeless veterans with an estimated 13,067 unsheltered veterans
- Two ratios were created for each State:
- Ratio of Total Veterans PIT Homeless estimate to New VASH allotment
- Ratio of PIT Unsheltered Veteran Homeless estimate to New VASH allotment
- The first ratio showed a national average of 7.5 homeless veterans for every new VASH slot with a range from 4.0 in Mississippi (144 homeless veterans; 36 new VASH slots) to 17.4 in Colorado ( 1,181 homeless veterans: 68 new VASH slots).
- The second ratio showed a national average of 2.5 unsheltered homeless veterans for every new VASH slot with a range from 0.0 in Rhode Island (0 unsheltered, 21 new VASH) to 6.6 in Nevada (414 unsheltered, 63 new VASH).
- The report does not have data on the number of current unused VASH vouchers. This information would impact any review of equitable distribution.
The NHIP provides this information to communities seeking to ensure equity in the distribution of homeless funding and to provide statistic support for communities seeking to advocate for greater federal or state resources.
Posted 07.05.16
Report shows large increase in Veterans receiving Service-Connected compensation - huge increase in higher "rating" levels
The NHIP has completed a Historical Trend Analysis of VA Service-Connected Disability Compensation at four points in time - 2002, 2006, 2010, and 2015. Key findings include:
1) 30% increase in veterans receiving SC compensation from 2010 to 2015.
2) 67% increase in 100% combined degree (rating) and 141% increase in 90% combined degree (rating) from 2010 to 2015. Since 2002, there has been a 629% increase in 90% combined degree and a 390% increase in 80% degree.
3) 74% increase in the number of veterans receiving SC compensation from 2002 to 2015 despite a 14% decrease in the number of living vietnam era veterans.
4) More than doubling of the percentage of living veterans receiving SC compensation from 9% of all living veterans in 2002 to 19% in 2016. In 2015, a total of 4.19 million veterans received service connected compensation.
An NHIP Analysis of the Change in Distribution of SC Compensation by Service Period also revealed:
1) From 2010 to 2015, the number of Vietnam veterans receiving SC compensation increased 23% (from 1.09 million in 2010 to 1.35 million in 2015) during a time when the overall number of living Vietnam Veterans fell an estimated 8%.
2) Increase of 69% in Gulf War/Global War on Terror veterans receiving SC compensation from 2010 to 2015.
3) 2015 marked the first time that new compensation awards eclipsed 300,000 with a total of 313,052 new claims.
4) Gulf War veterans receiving SC compensation reached 1.87 million, up 69% from 1.11 million in 2010.
5) 53% in WWII veterans receiving benefits from 2010 to 2015 with only 102,744 living WWI vets receiving SC compensation.
Posted 06.30.16
NEW ! 2015 VA Summary of Medical Care report
NHIP Report Highlights:
1) A total of 5,930,130 veterans (27.5% of all living veterans) received medical care during 2015 costing a total of $65.6 billion for an average of $11,055 per veteran. Medical Care represented 39.2% of all VA expenditures.
2) A State-by-State analysis shows that medical costs per veteran varied from $14,985 in Massachusetts to $9,082 in South Carolins.
3) Usage of VA Medical Care ranged from a low of 18.7% of veterans living in New Jersey to a high of 42.1% of veterans living in South Dakota. The U.S. Territory of Puerto Rico reported 62.1% of its veterans receiving VA medical care.
Cost per veteran for medical coverage from the VA report can be utilized to support leverage totals for HUD programs serving veteran households. CLICK HERE to view State-by-State expenditure and coverage rates.
The NHIP is working on summarizing VA data at the County level. The analysis and charts will be posted in the next few weeks.
A grassroots collaboration sharing information and knowledge about homeless services